[Company Logo Image] 

Home Up Contents Coffee Break Credits Glossary Links Search

 
Performance Data Collector


Home
Analysis Services
Azure
CLR Integration
High Availability
Open Source
Security
SQL Server 2008
SQL Server 2012
SQL Server 2014
SQL Server 2016
SQL Server 2017
SQL Server 2019
Tips
Troubleshooting
Tuning

Performance Data Collector

Applies: SQL Server 2008 (Katmai) CTP November 2007, SQL Server 2008 Enterprise Edition


SQL Server 2008 introduces Performance Data Collector (PDC) a new component of SQL Server Management Studio for satisfying our performance data needs for tuning SQL Server instances and be able to provide predictability in terms of performance to end users and applications on today's data explosion era.


Default Collection Sets.

There are 3 defaults collection sets, installed during SQL Server 2008 setup process. These are called the system data collection sets, which are:
 

bullet 
Disk usage. Collect data about disk usage per database.
bullet 
Query Statistics. Records query statistics, individual query text, query plans, and specific queries.
bullet 
Server Activity. Collects resource usage statistics and performance data from the server, the operating system and SQL Server.


Benefits.
 

bullet 
Easy configuration. Configuration requires just a few clicks.
bullet 
Useful for event tracking, benchmarking and monitoring a system's general health
bullet 
Centralized data storage. You can collect in one central repository performance data of many instances and servers in your organization.
bullet 
Low overhead data collection. PDC uses very little CPU, a maximun of 5% total CPU time.
bullet 
Extensible collection. There are 3 defaults collection sets, but you can create your own collection sets, or adjust existing ones to suit your needs.


Limitations.
 

bullet 
Only works on SQL Server 2008 instances for now.
bullet 
Disk usage collection set does not show information for drive free space for now.


Planning for Configuring Performance Data Collector.

If your planning to use the defaults collection sets, please take the following in consideration:


bullet 
A folder must be created on each server prior to configure Performace Data Collector, with read/write permissions for the SQLSERVERAGENT service account. Performance data will be collected on that directory and later will be uploaded to a central database.
bullet 
Also, the central database must be created prior to configure Performace Data Collector. This database is a regular database that will contain all the data that is retained, and is called the Management Data Warehouse (MDW).
bullet 
Storage requierements. Plan for 250 to 350 MB per day.
bullet 
Data is purged every 14 days by default, but it can be ajusted
bullet 
Disk Usage Collection Set collects data every 5 seconds. Upload occurs every 6 hours. Data is retained for 90 days. All these intervals can be adjusted.
bullet 
Query Statistics Collection Set collects and uploads data every 15 minutes. Data is retained for 14 days. All these intervals can be adjusted.
bullet 
Server Activity Collection Set collects data every 60 seconds, except for active sessions and requests which data is collected every 10 seconds. Upload occurs every 15 minutes. Data is retained for 14 days. All these intervals can be adjusted.
bullet 
MSDB database is used for storing configuration information, run-time information, auditing and collection history information. SSIS packages are stored in MSDB.
bullet 
SQL Server Agent is important, because when a collection set is activated, data collection jobs are created. When a collection set is deleted, all its correspondent jobs are also deleted.
bullet 
SQL Server Integration Services is needed because SSIS packages are used to collect data and upload it to the Management Data Warehouse. SSIS packages also generate events during data collection that are used to monitor and troubleshoot the collection process.
bullet 
Data Collector Security. On the Configure Data Warehouse Wizard you will need to map logins and users to specific management data warehouse roles. These roles are: mdw_admin, mdw_reader and mdw_writer. mdw_reader is for logins and users that need to view historical reports. mdw_writer role can upload and write data to the management data warehouse, for that reason every SQLServerAgent service account used on remote data collectors that stores data in a central management data warehouse has to be a member of this role, and should have rights in both servers (if not you should use proxies acccounts). Finally, the mdw_admin role have read, write, update and delete access to the management data warehouse. Any login and user assigned to the mdw_admin role can change the schema on MDW and run maintenance jobs. There are fixed database roles provided for data collector, includind dc_proxy, that should be reviewed on Books Online (look for "Data Collector Security" in BOL) when planning for data collector. By default, no user is a member of these fixed database roles.


Configuring Performance Data Collector.


Now, let's configuring Performance Data Collector.


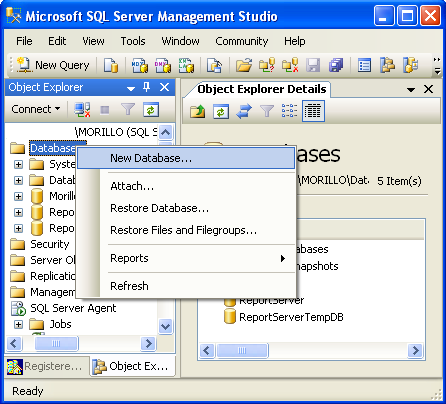
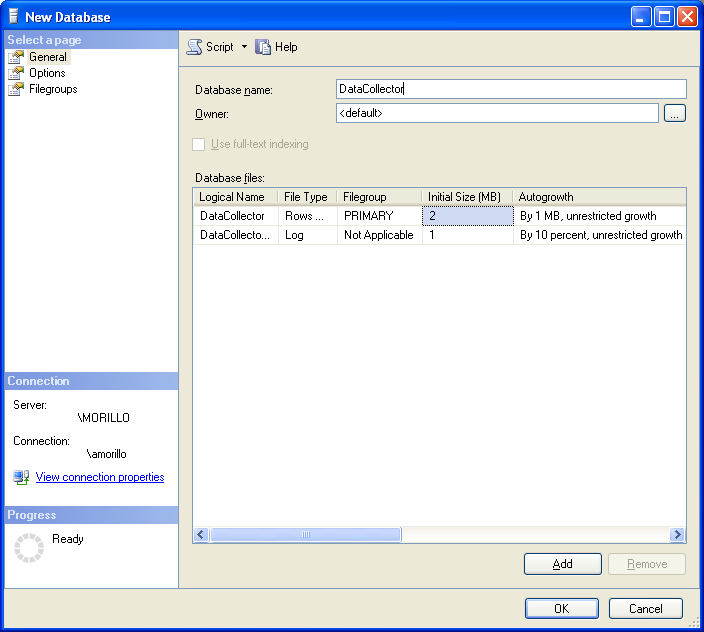
First, let's create the Management Data Warehouse.


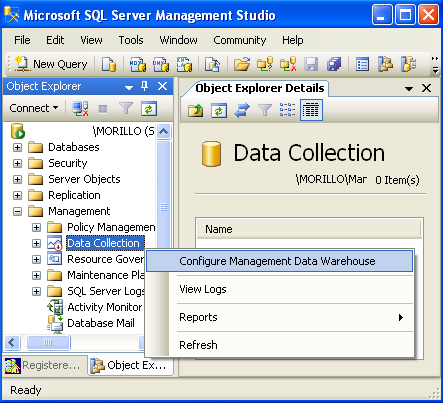
Now, let's configure the Management Data Warehouse.


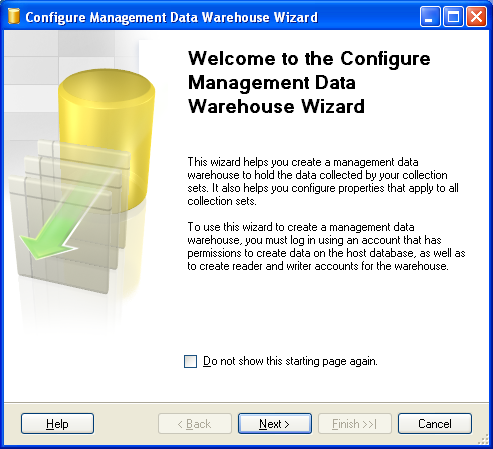
Please click on Next on the Welcome screen below.


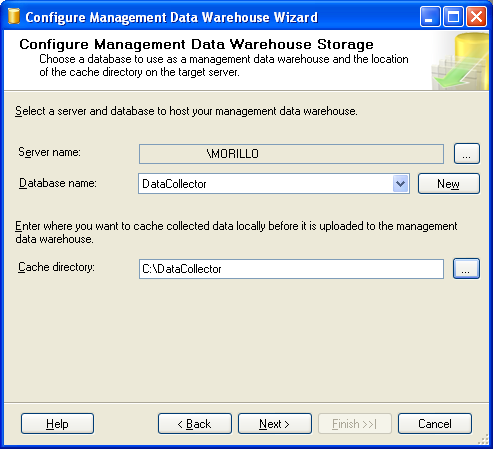
In the screen below, you may want to specify a unique Management Data Warehouse, (MDW) a database where you want to collect performance data for all instances in your organization.  Also, you need to specify where the performance data collected from this instance will be placed locally prior to be uploaded to MDWehouse.  In our example, we will have the MDW located in the same server, however this is not a best practice. 


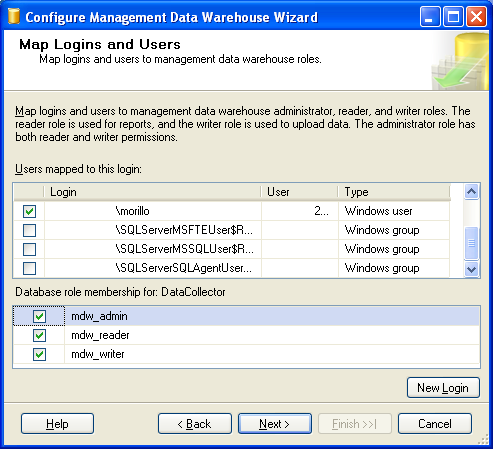
Here we are giving the mdw_admin role to the SQLServiceAgent service account on this instance.


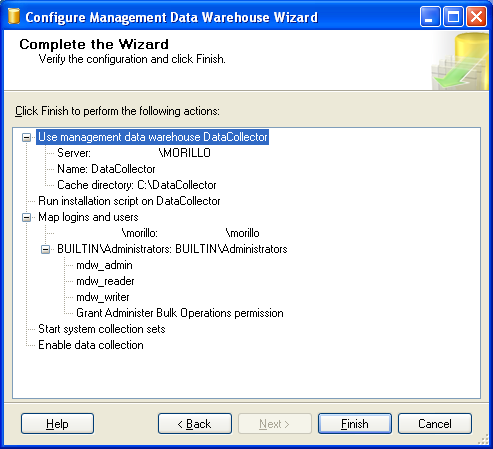
On the screen below, let's verify the configuration prior to complete the wizard.


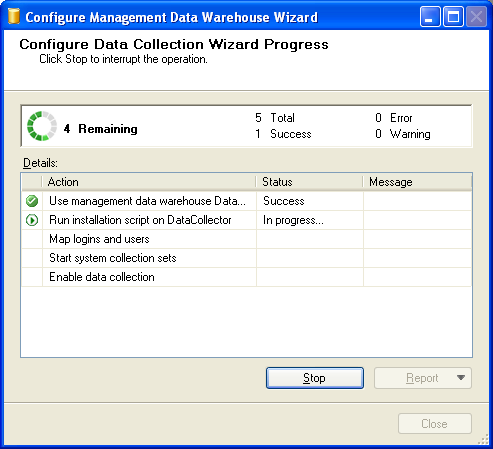
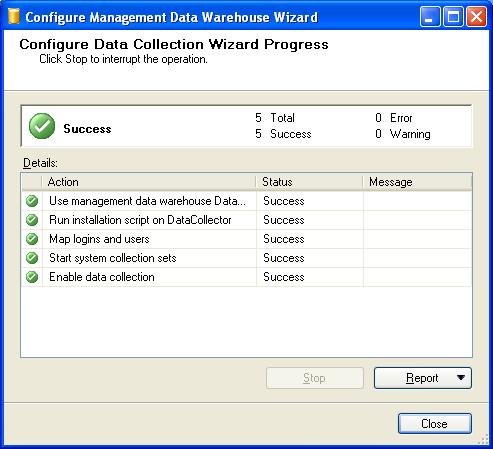
Configuration is in progress ...


At the end, we have a successful MDW configuration.


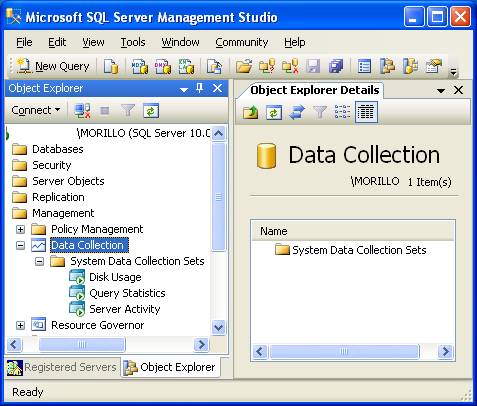
Now, after stressing the server a little bit while executing some queries on the AdventureWorks database, we have some data available for our historical reports.  To access them, expand Management on SQL Server Management Studio (SSMS), and later expand Data Collection.


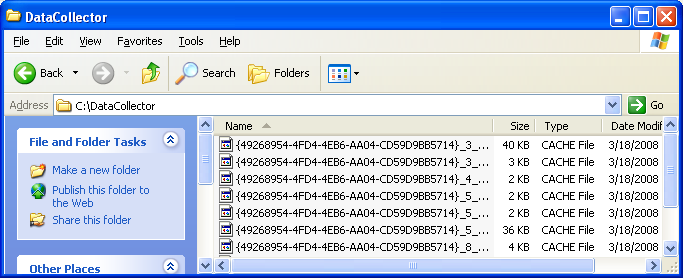
Below you see how the performance data is stored in the local cache prior to uploading the data to the MDW.


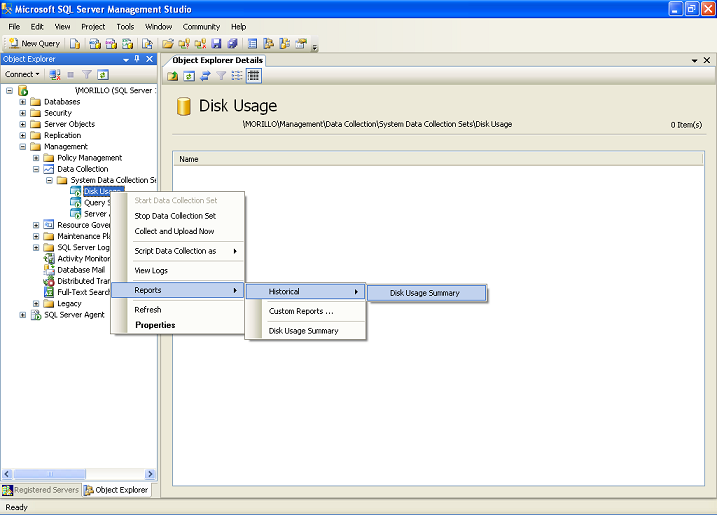
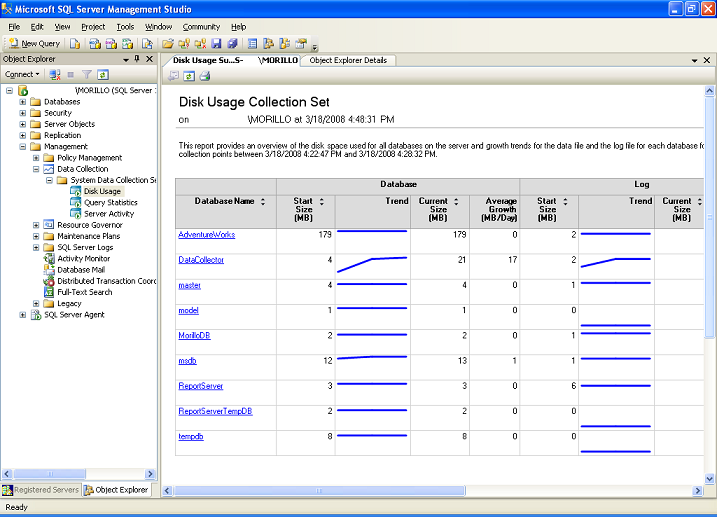
On the screen below, we are running the Disk Usage Summary report which is part of the Disk Usage collection set.


As you can see, disk usage per database is shown.


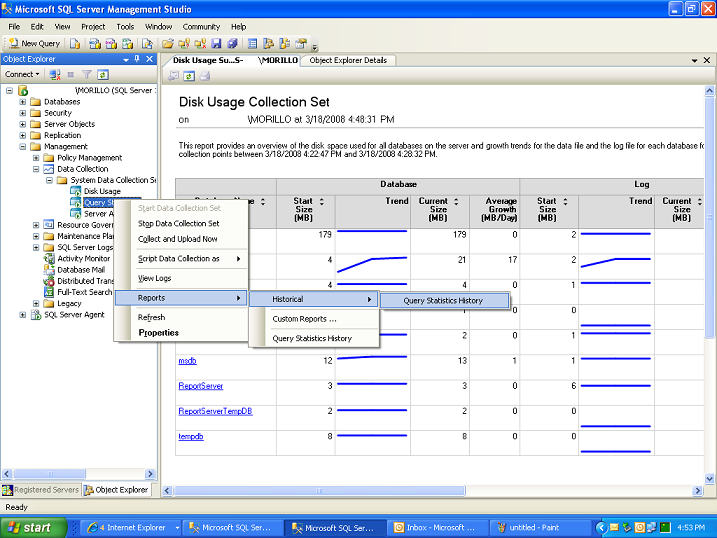
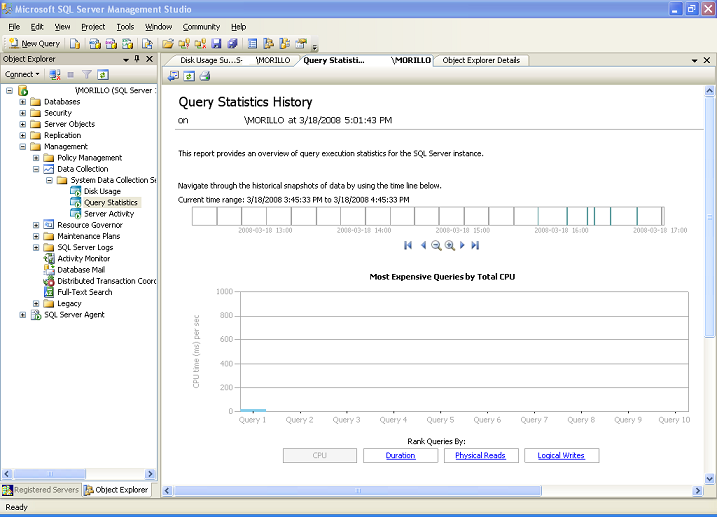
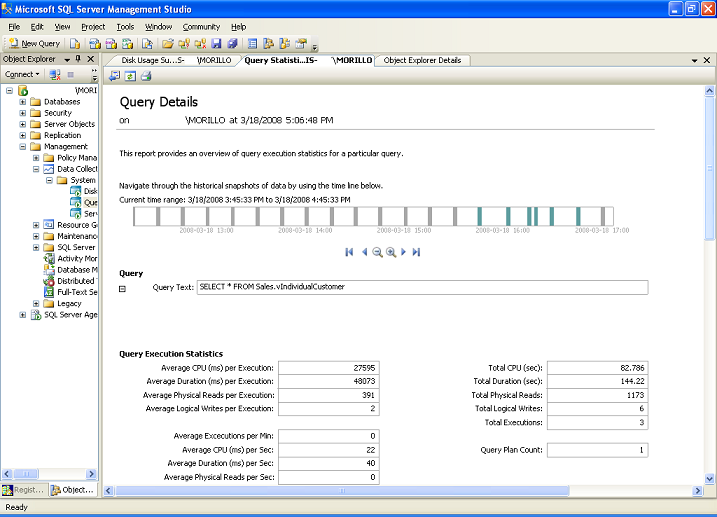
Next, let's take a look to the Query Statistics History report.


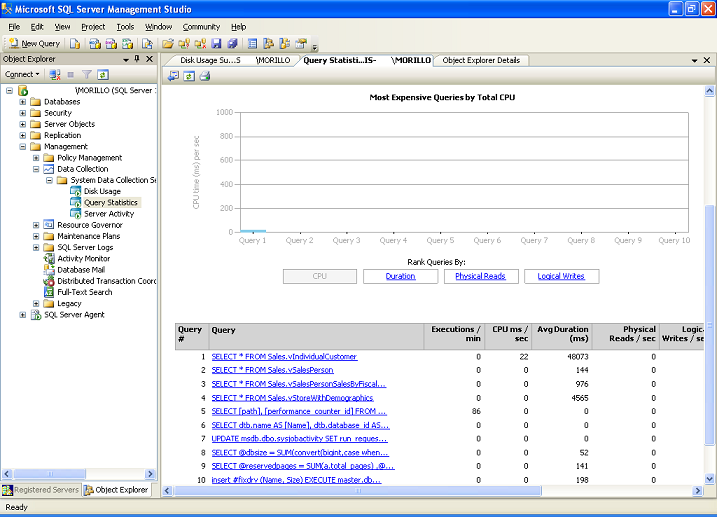
This report shows the most expensive queries in 4 categories: CPU, duration, physical reads and logical writes.


You can click on any query and get a detailed information for that query.


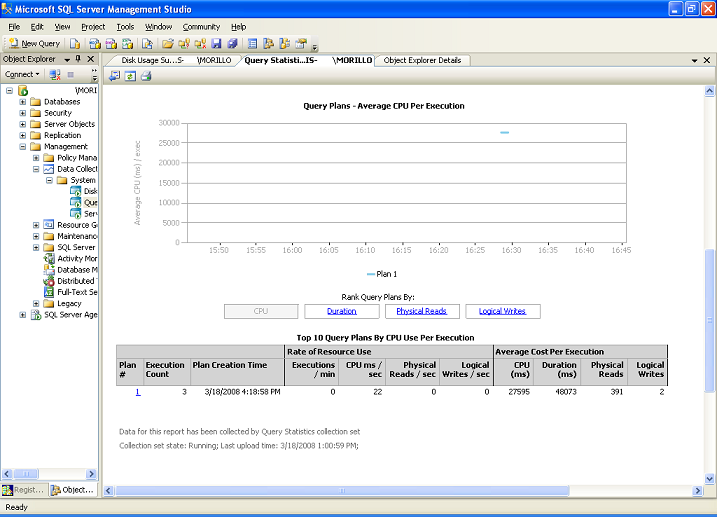
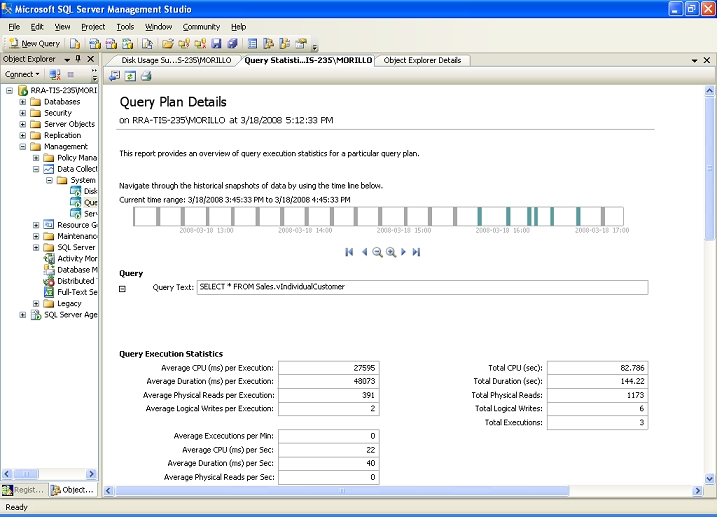
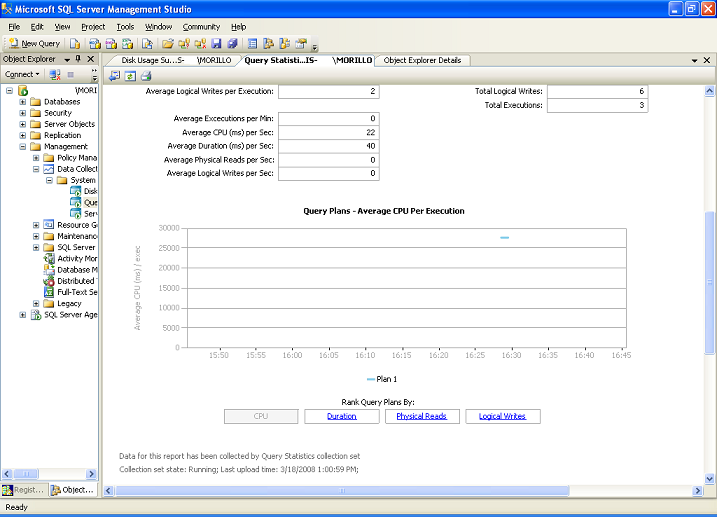
At the bottom of the Query Details report, you can choose to take a look at the details for the query plans used by the query specified.


On the Query Plan Details sometimes recommendations are given to add indexes where needed based on the query specified.


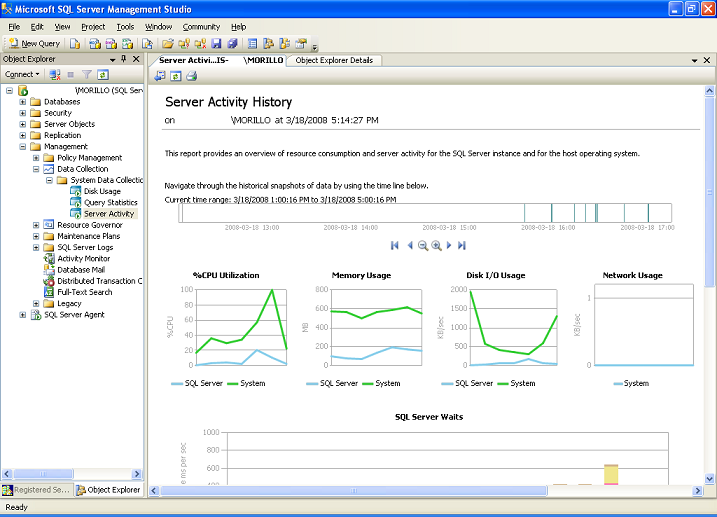
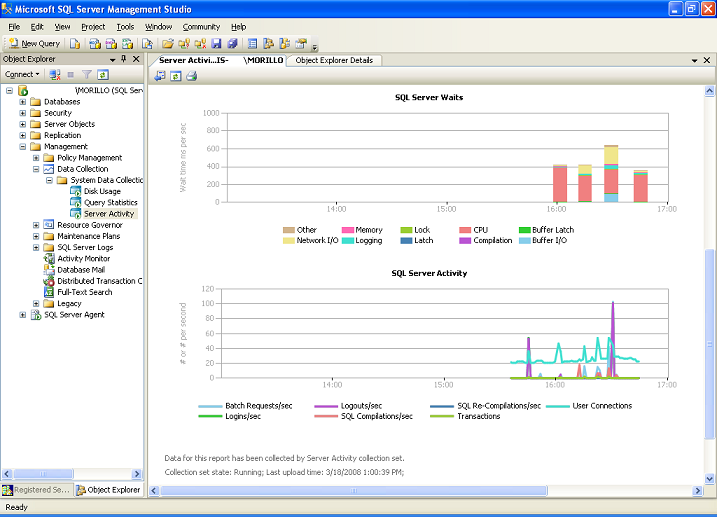
Finally, let's see the reports about performance data collected from the Server, the operating system and SQL Server.


Please appreciate the detailed information related to SQL Server Waits that this report is bringing to us.


Performance Data Collector is another DBA's dream come true, and let me remind you that the data collections and the reports are extensible.


References.

SQL Server 2008 Books Online, CTP 5 November 2007.

SQL Server 2008: The Data Collector, Part 1


.Send mail to webmaster@sqlcoffee.com with questions or comments about this web site.