![[Company Logo Image]](images/SQLCofee.jpg)
![]()
![]()
![]()
![]()
![]()
![]()
![]()
![]()

|
|
|
|
Using SQL Azure and Power BI for creating reports.
Date created: 9/3/2017.
This articles requires to download and install an Power BI for Desktop if you do not want to use the online version of Power BI. We also need to load the New York Taxi Cab data from Azure BLOB storage wasbs://2013@nytpublic.blob.core.windows.net/ into a SQL Azure database or a SQL Azure Data Warehouse database.
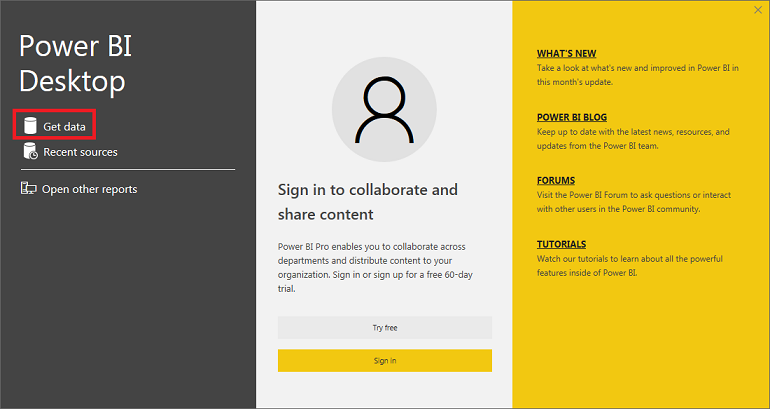
Once we have installed the prerequisites and loaded the sample data, let's open
Power BI for Desktop if you want to use the desktop version
and then make a click on "Get data" as shown on below image.
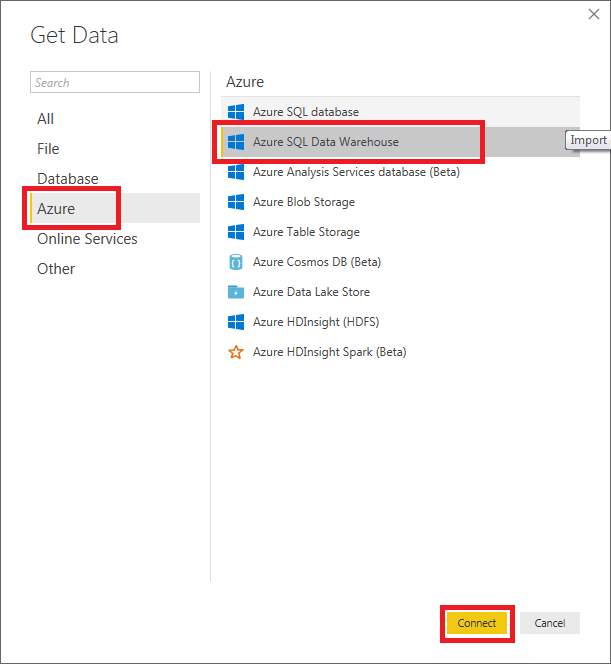
Make a click on Azure on the left side of the "Get Data" dialog and the choose Azure SQL Data Warehouse or Azure SQL Database as the data source, then make a click on the Connect button.
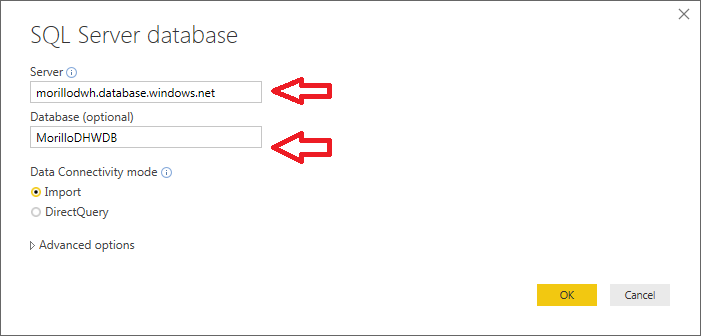
On the "SQL Server database" dialog provide the name of the Azure database server, and choose between the two available data connectivity modes.
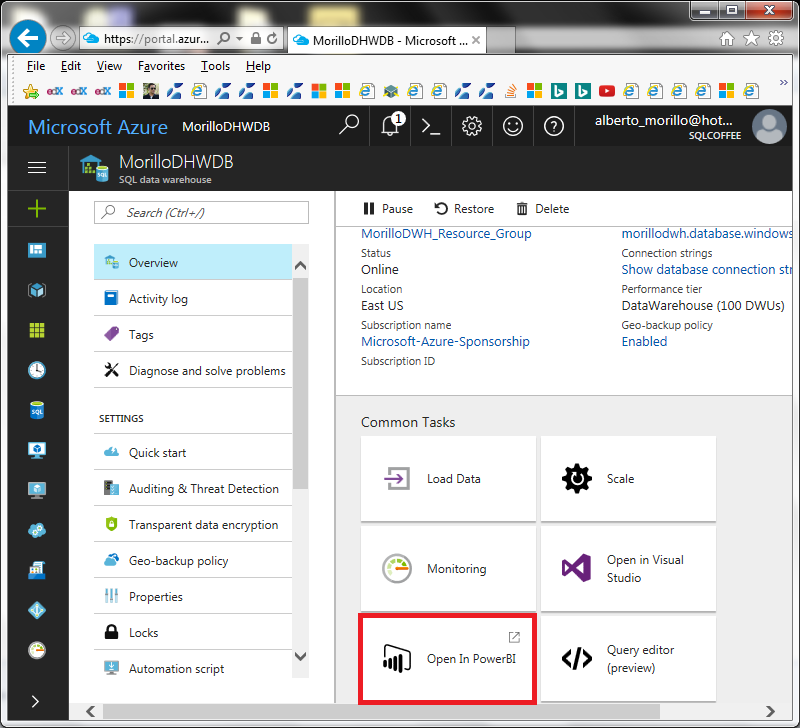
Alternatively, you can also launch the online version of Power BI from the Azure portal as shown on below image.
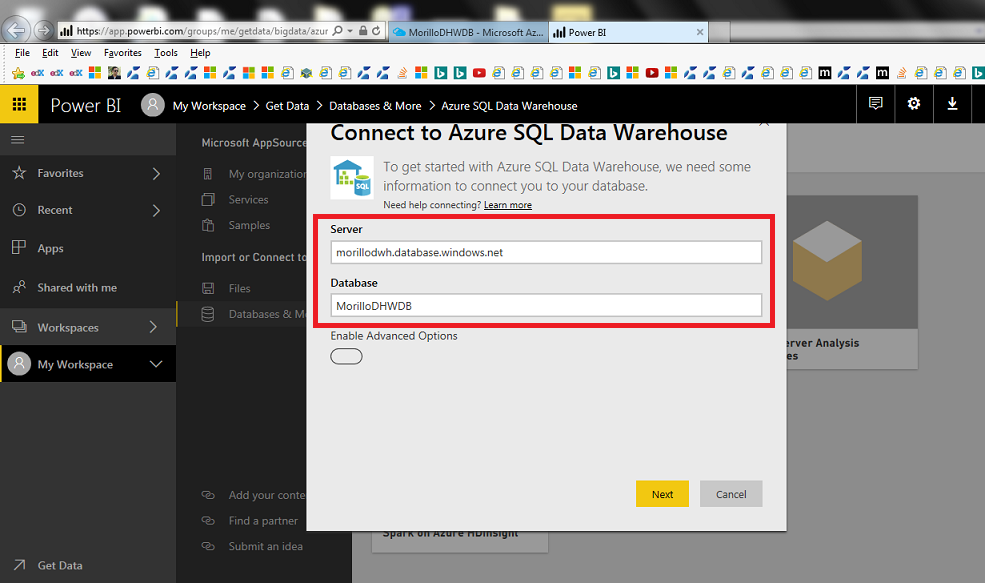
As you can see on the next image, Power BI request the server name and database name to connect to the data.
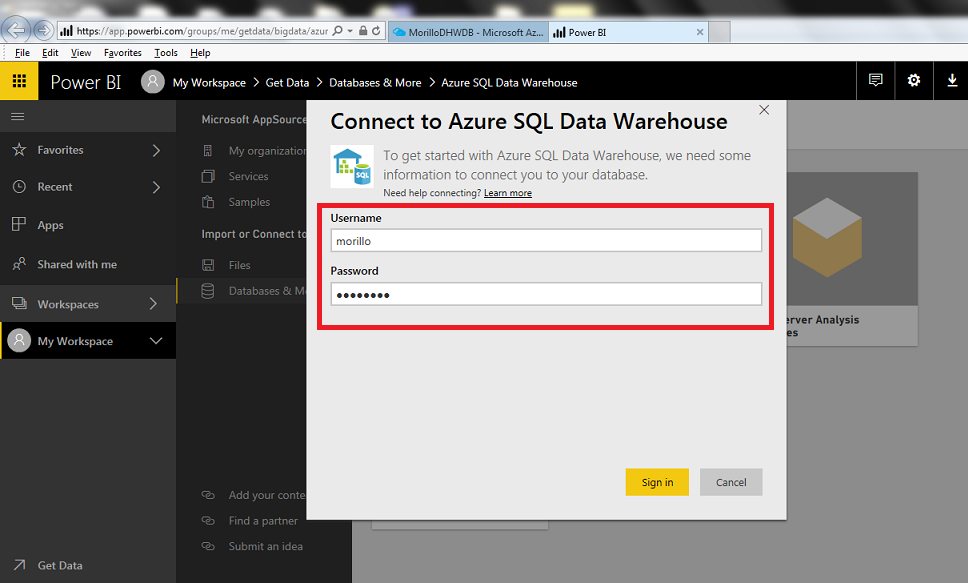
We need to provide user credentials to access the SQL Azure Data Warehouse database.
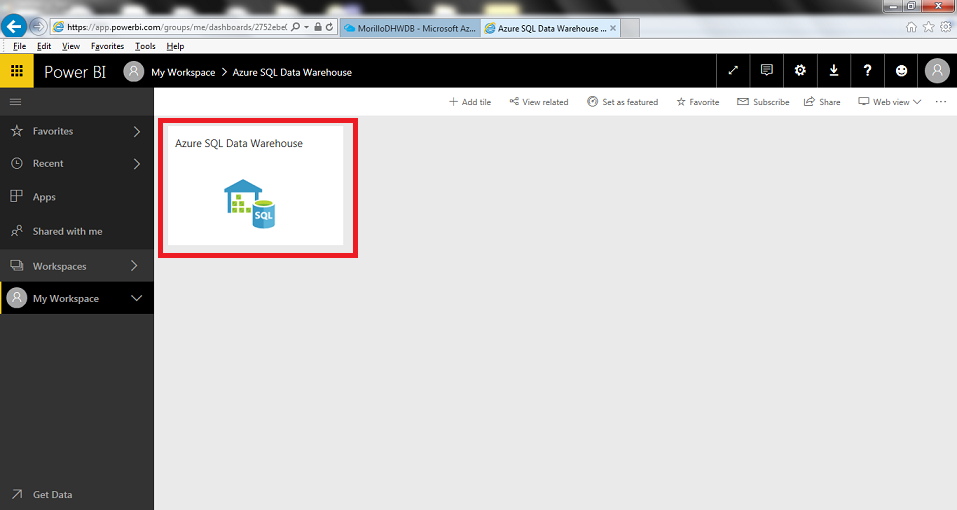
Once connection to the database has been established a tile as shown on below image is placed on your workspace. Make a click on it to start creating a report using that data source.
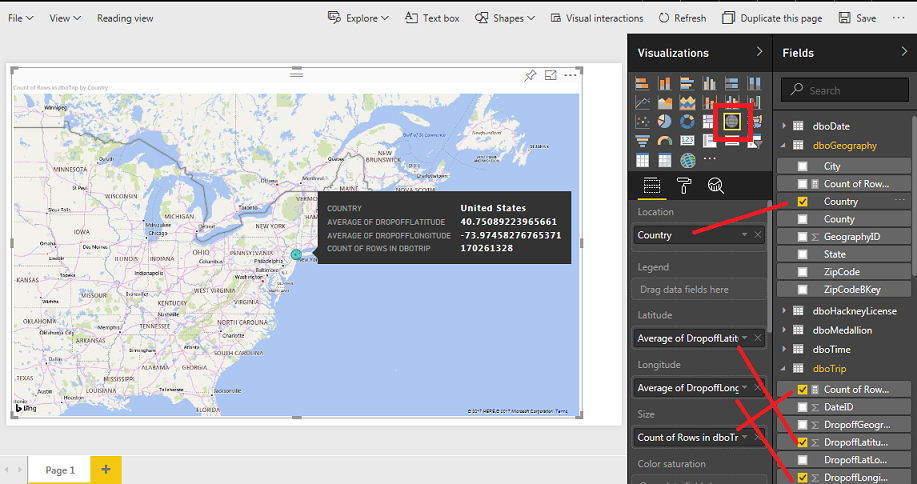
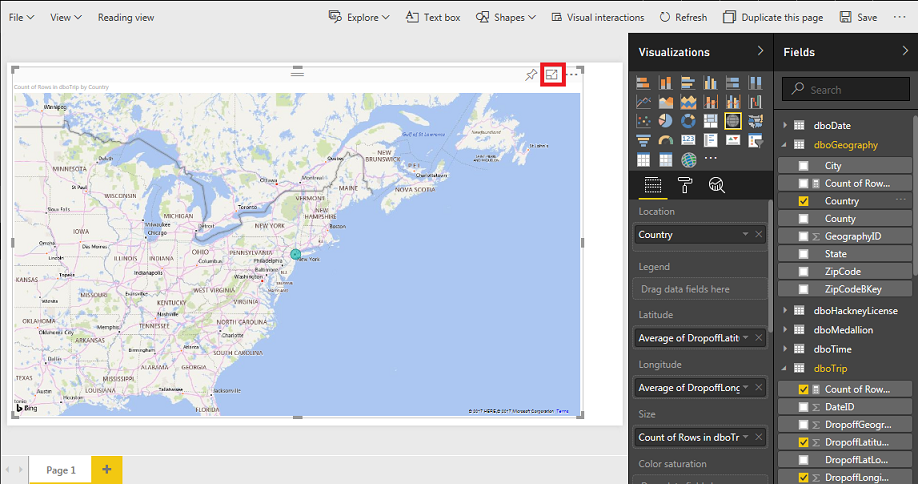
On below screen we choose a map visualization specified with a red square, then we provided County (of the dboGeography table) to the Location field, selected "Count of Rows" on the dboTripTable, dragged the DropoffLatitude (from the dboTrip table) to the Latitude field, and dragged the DropoffLongitude to the Longitude field.
On the top right side of the map, we now can make a click on the outlined area with red square line to get a street view.
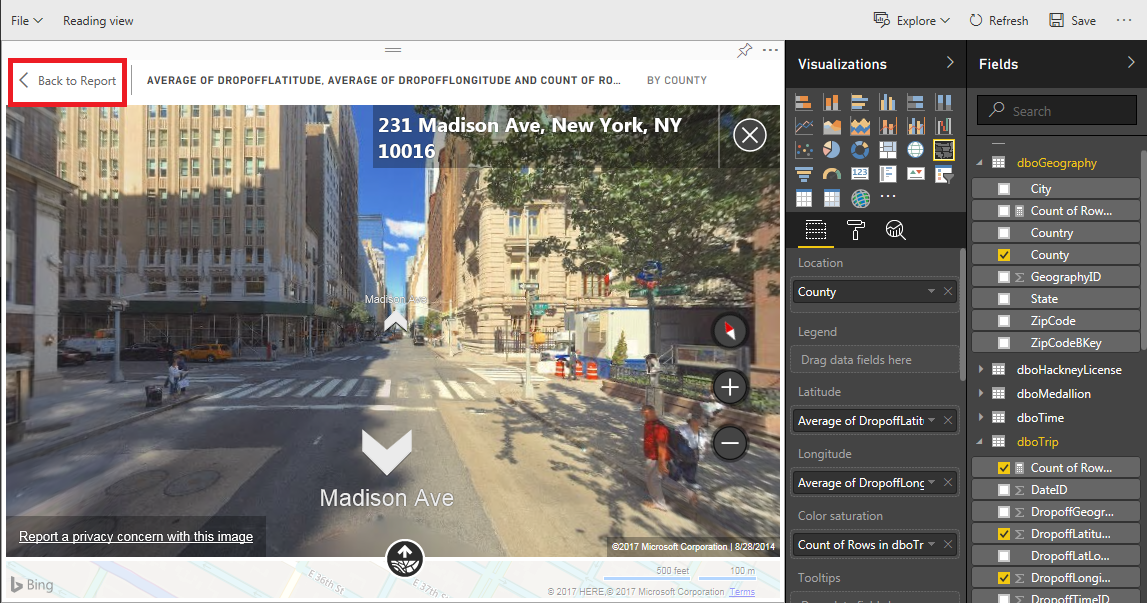
Below you will see the street view obtained.
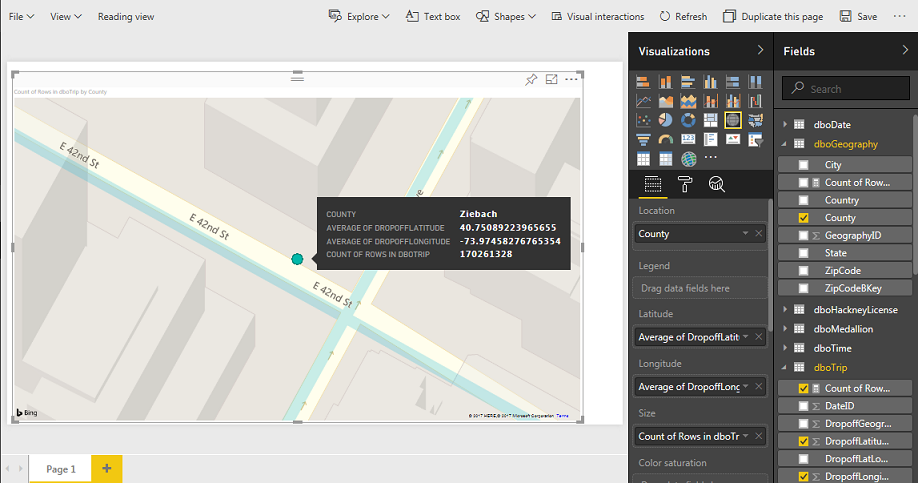
The following screen shows the details of ä selected street from the map, among with a photo of that street coming from Bing. To return to the street view you can make a click on "Back to Report.
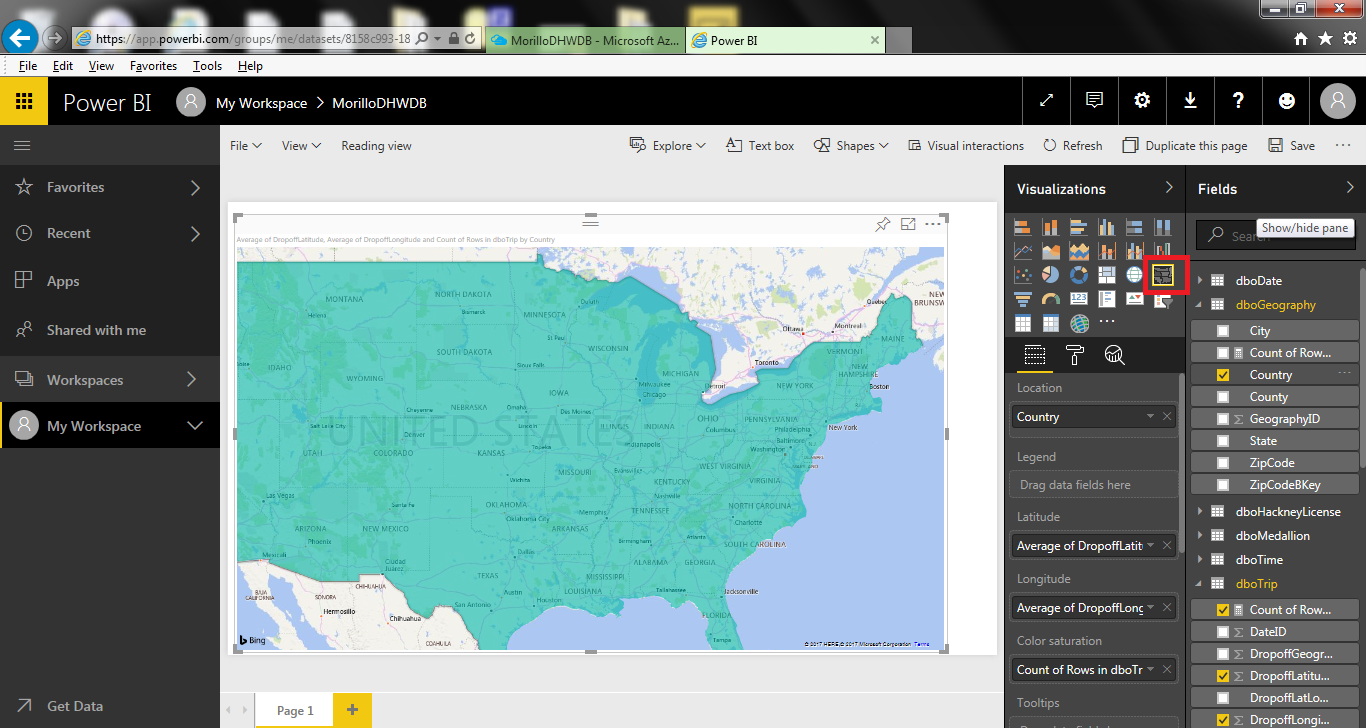
Finally, we changed to a different map visualization on Power BI.
|
|
.Send mail to
sqlcoffee.stretch737@simplelogin.com with
questions or comments about this web site.
|